Dear Pictograph: Investigating the Role of Personalization and Immersion for Enjoying Data Visualizations
Much of the visualization literature focuses on assessment of visual representations with regard to their effectiveness for understanding data.
In the present work, we instead focus on making data visualization experiences more enjoyable, to foster deeper engagement with data.
We investigate two strategies to make visualization experiences more enjoyable and engaging: personalization, and immersion. We selected pictographs (composed of multiple data glyphs) as this representation affords creative freedom, allowing people to craft symbolic or whimsical shapes of personal significance to represent data. We present the results of a qualitative study with 12 participants crafting pictographs using a large pen-enabled device and while immersed within a Virtual Reality environment. Our results indicate that personalization and immersion both have positive impact on making visualizations more enjoyable experiences.
We investigate two strategies to make visualization experiences more enjoyable and engaging: personalization, and immersion. We selected pictographs (composed of multiple data glyphs) as this representation affords creative freedom, allowing people to craft symbolic or whimsical shapes of personal significance to represent data. We present the results of a qualitative study with 12 participants crafting pictographs using a large pen-enabled device and while immersed within a Virtual Reality environment. Our results indicate that personalization and immersion both have positive impact on making visualizations more enjoyable experiences.
Material from the study
Glyphs drawn in the VR condition
You can click on an image to see it in a 3D viewer.
Models available in the VR condition
You can click on an image to see it in a 3D viewer.
Glyphs drawn in the 2D condition
Models available in the 2D condition

Results from the study
Here is the material from the study:
 Instructions of the study (click to download)
Questions of the study (click to download)
Here is the raw data from the study:
Raw data used in our paper (click to download)
Each square represents a specific quote that a participants made about a specific condition.
You can hover it to see the quote.
Instructions of the study (click to download)
Questions of the study (click to download)
Here is the raw data from the study:
Raw data used in our paper (click to download)
Each square represents a specific quote that a participants made about a specific condition.
You can hover it to see the quote.
Charts from the study
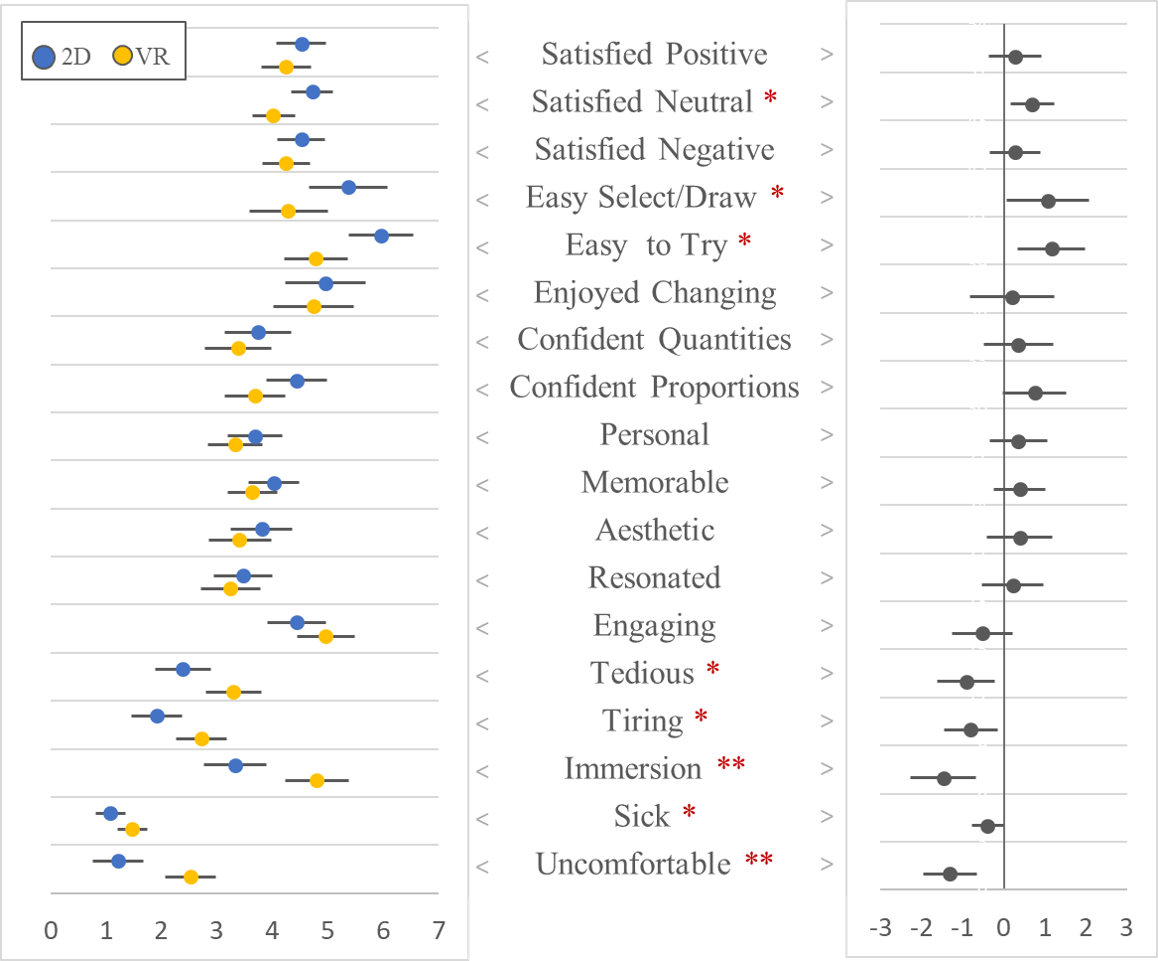 Figure 1: Participants mean rating for Immersion with significant differences indicated by * (error bars are 95% Confidence Intervals)
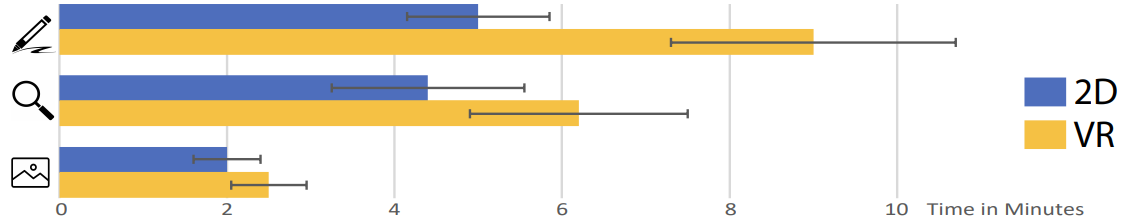 Figure 2: Indicative task time in minutes for each condition
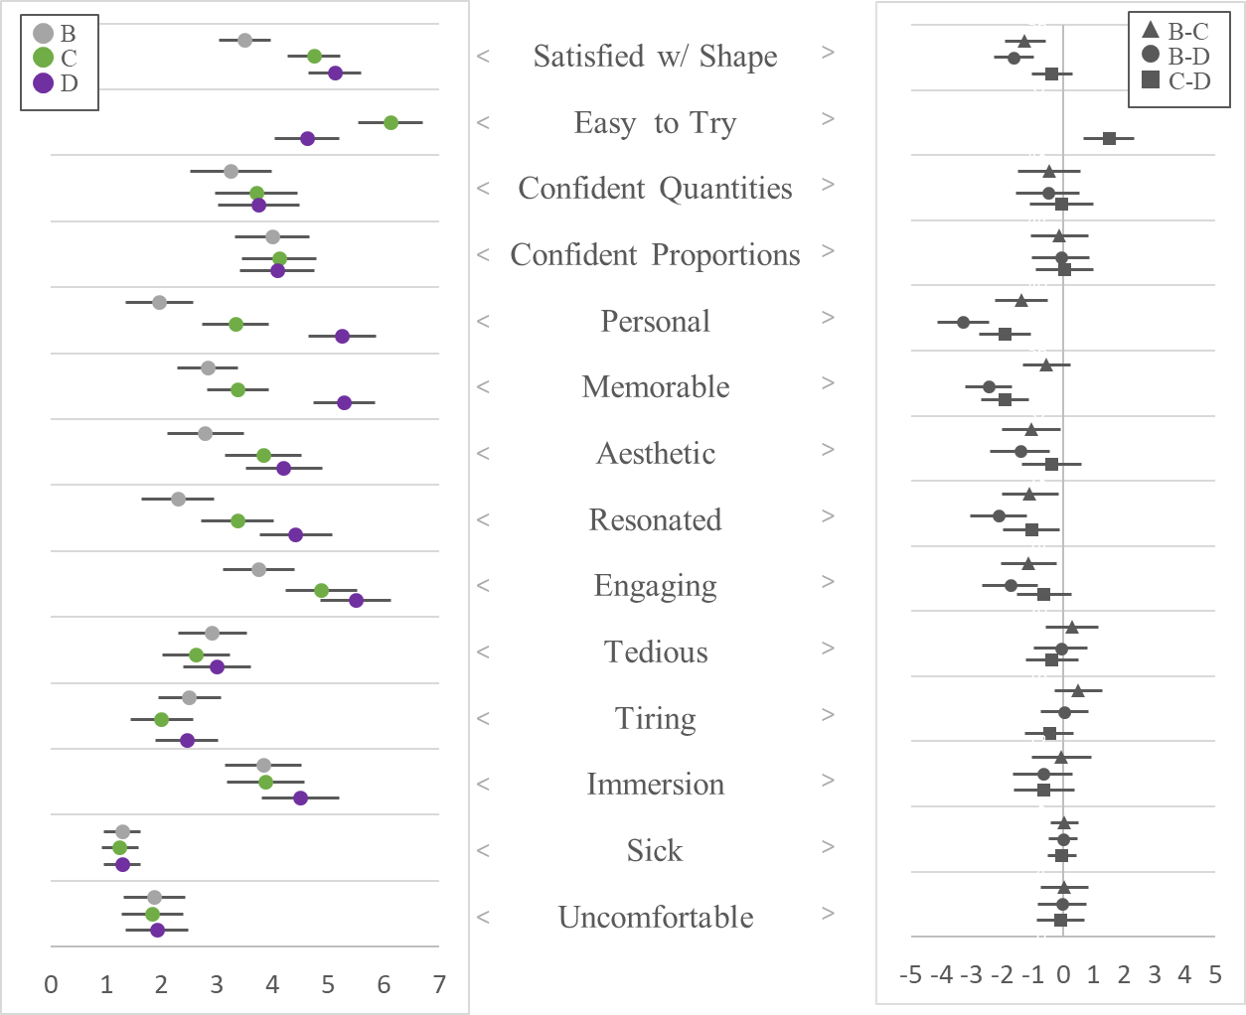 Figure 3: Participants mean rating for Personalization
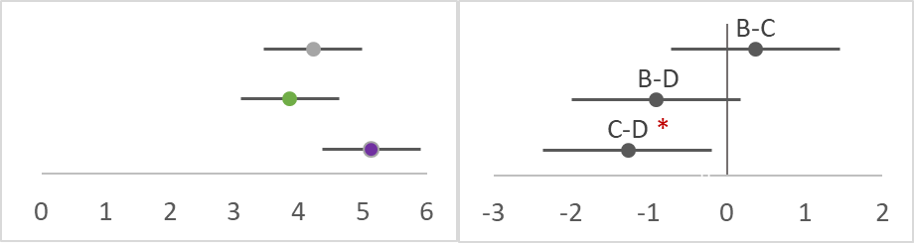 Figure 4: Participants mean for Memorability with significant differences indicated by * (error bars are 95% Confidence Intervals)